1. Executive summary
Tokenized equities (xStocks) on Solana do not have one liquidity problem — they have a dispersion problem. The deep majors already trade tight to NBBO fair value (NVDAx 12 bps, TSLAx 13 bps in market hours). The long tail and single-name ETFs do not (MSFTx 46 bps, COINx 32 bps, HOODx 31 bps). And across every name, the after-hours window is taxed: the TSLAx that costs 13 bps in market hours costs 71 bps after the close; HOODx jumps from 31 to 155 bps.
That dispersion is the wedge. Where a market is already tight (NVDAx, TSLAx in market hours), a sponsored market adds little. Where it is wide — long-tail names, single-stock ETFs, and all names after hours — a reward market that pays makers for measured execution can close a gap that demonstrably exists today.
Findings span 13 pairs, 243,280 swaps, $103,903,507 of on-chain volume over the trailing 30-day window (2026-04-14 → 2026-05-13). This is a complete on-chain capture — no sampling, no extrapolation. Every dollar figure is the literal sum of observed fills.
2. Headline findings
The picture is not "xStocks are expensive." It is that execution quality is spread across a wide range — by name and by session. The table reports every pair; spreads are the median (p50) and 90th-percentile (p90) deviation from NBBO fair value, in basis points.
| Pair | Swaps | Volume (USDC) | Mkt p50 | Mkt p90 | A/H p50 | A/H p90 |
|---|---|---|---|---|---|---|
| Majors & ETFs — deep, liquid names & broad baskets | ||||||
| TSLAx/USDC | 79,702 | $26,571,331 | 13.1 | 51.4 | 71.1 | 284.5 |
| NVDAx/USDC | 40,557 | $17,118,465 | 11.6 | 45.4 | 42.3 | 119.0 |
| QQQx/USDC | 19,424 | $11,990,712 | 12.4 | 33.7 | 41.0 | 118.2 |
| SPYx/USDC | 15,295 | $13,206,124 | 31.0 | 49.2 | 42.7 | 119.0 |
| AAPLx/USDC | 2,784 | $941,097 | 24.0 | 69.8 | 62.6 | 294.1 |
| Long tail — lower on-chain depth, wider and more session-sensitive | ||||||
| MSTRx/USDC | 43,450 | $17,085,043 | 21.6 | 68.8 | 104.6 | 272.3 |
| COINx/USDC | 14,204 | $7,900,787 | 31.5 | 86.0 | 154.3 | 334.1 |
| HOODx/USDC | 11,119 | $3,707,615 | 31.1 | 109.1 | 155.4 | 394.0 |
| AMZNx/USDC | 4,194 | $1,306,257 | 19.4 | 85.5 | 92.8 | 279.4 |
| METAx/USDC | 2,786 | $768,893 | 27.1 | 99.2 | 93.6 | 582.2 |
| GOOGLx/USDC | 2,510 | $1,151,814 | 19.5 | 64.4 | 96.5 | 595.0 |
| MSFTx/USDC | 3,584 | $881,290 | 45.5 | 169.7 | 129.3 | 235.9 |
| Gold — GLDx (Backed GLD-ETF wrapper), referenced to the GLD ETF | ||||||
| GLDx/USDC | 3,671 | $1,274,079 | 13.9 | 83.6 | 62.6 | 199.1 |
| All pairs | 243,280 | $103,903,507 | — | — | — | — |
All spreads in bps vs NBBO. Swap counts and volume are the full on-chain totals; spread percentiles are computed on fills with a fresh NBBO reference (see Methodology A.5). GLDx (Backed) wraps the GLD ETF, so its reference prices only in US market hours like the equities — its session split is measured on the same basis, which makes it a clean gold comparison alongside the single-name stocks.
3. Per-pair analysis
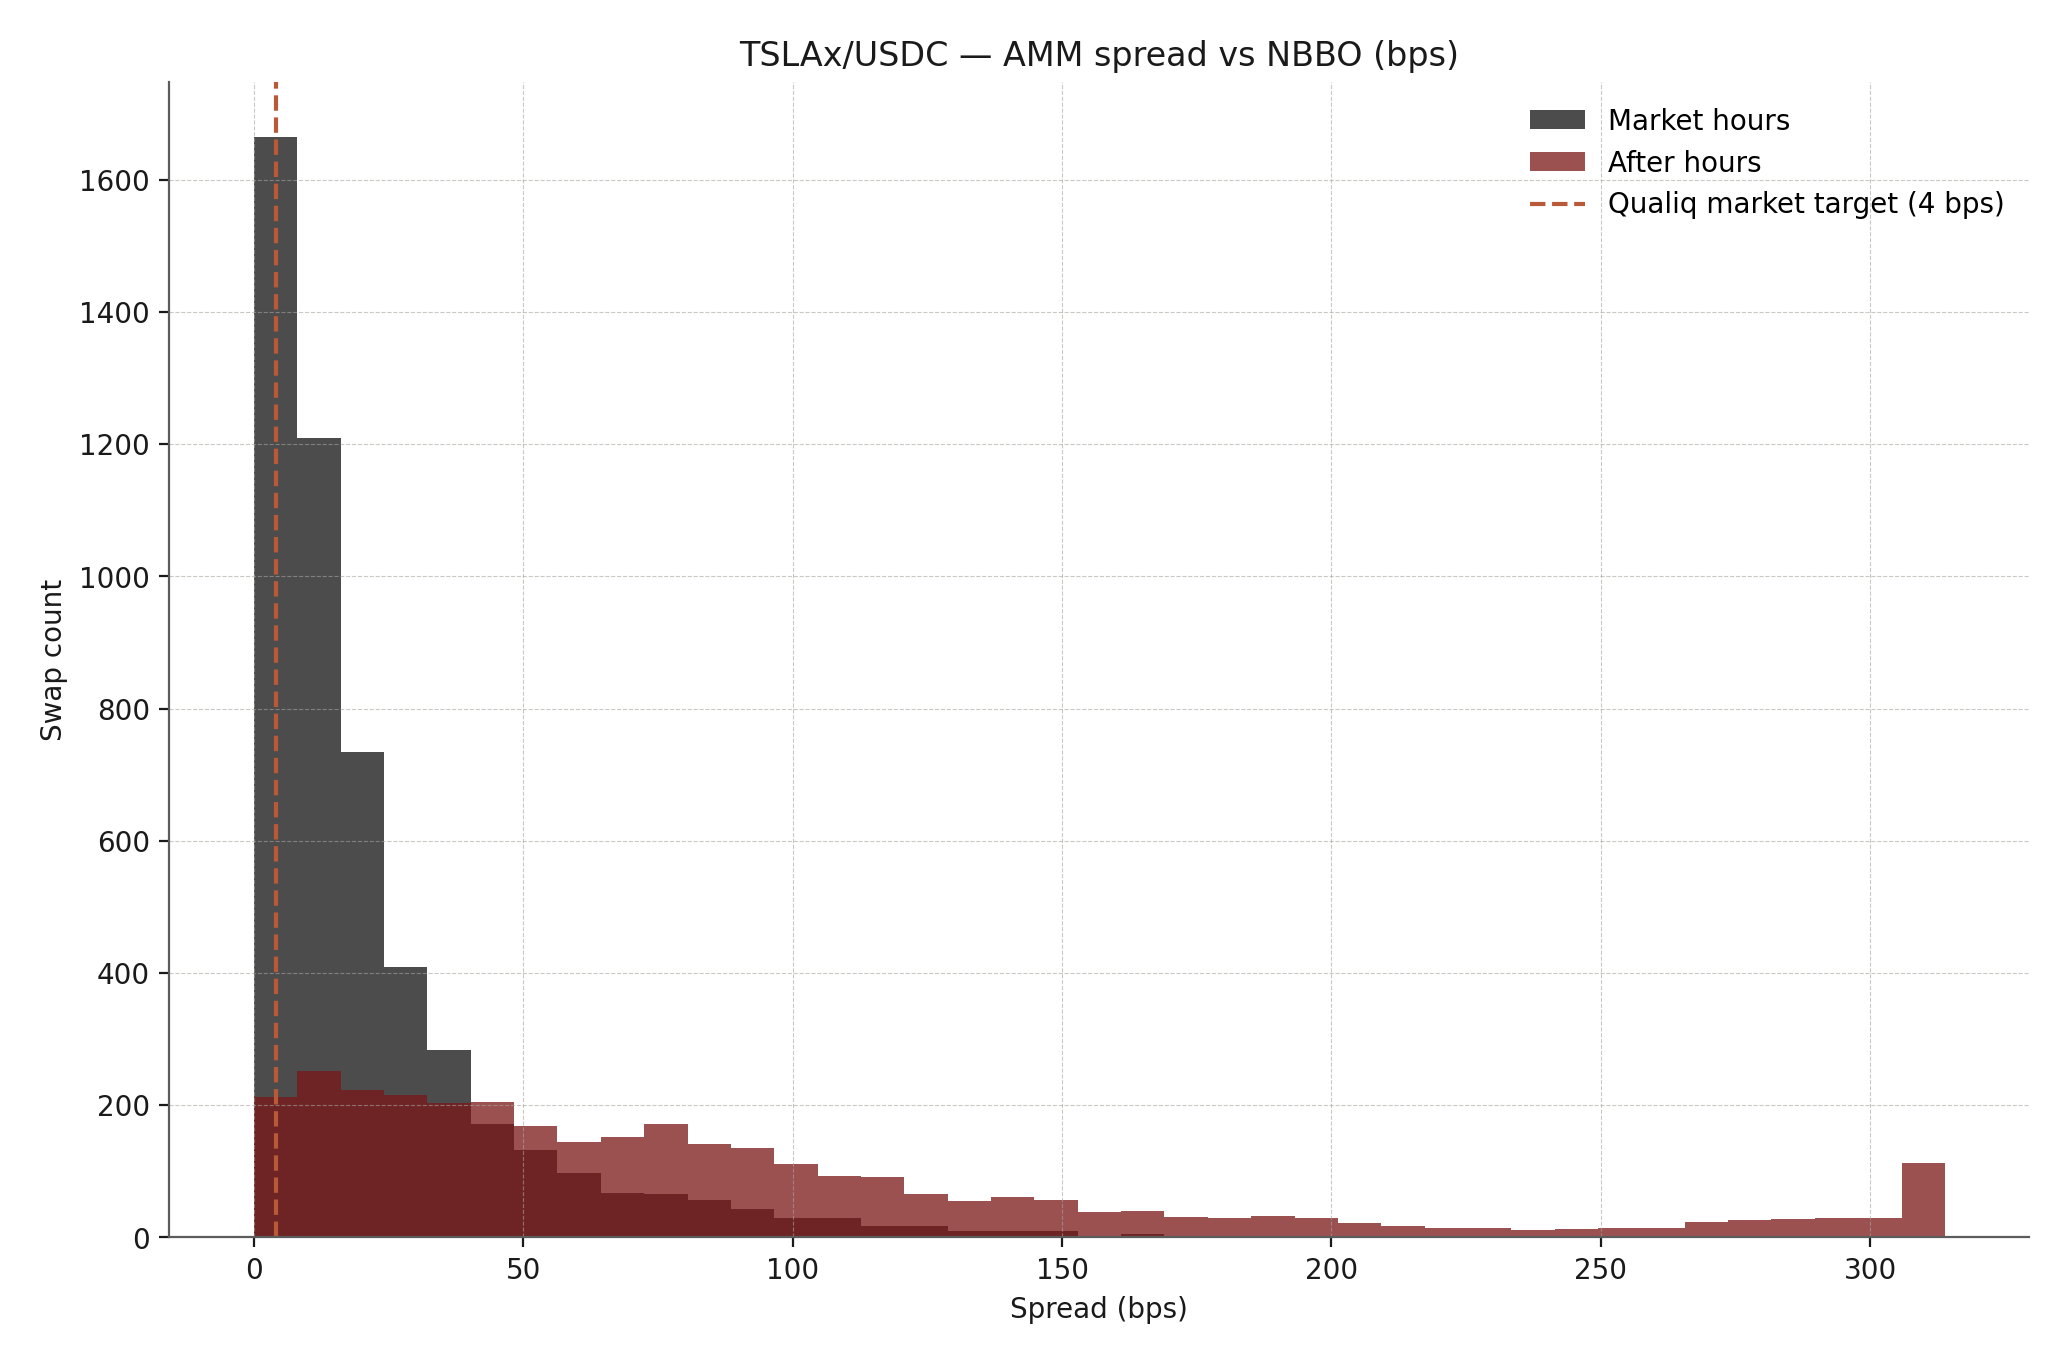
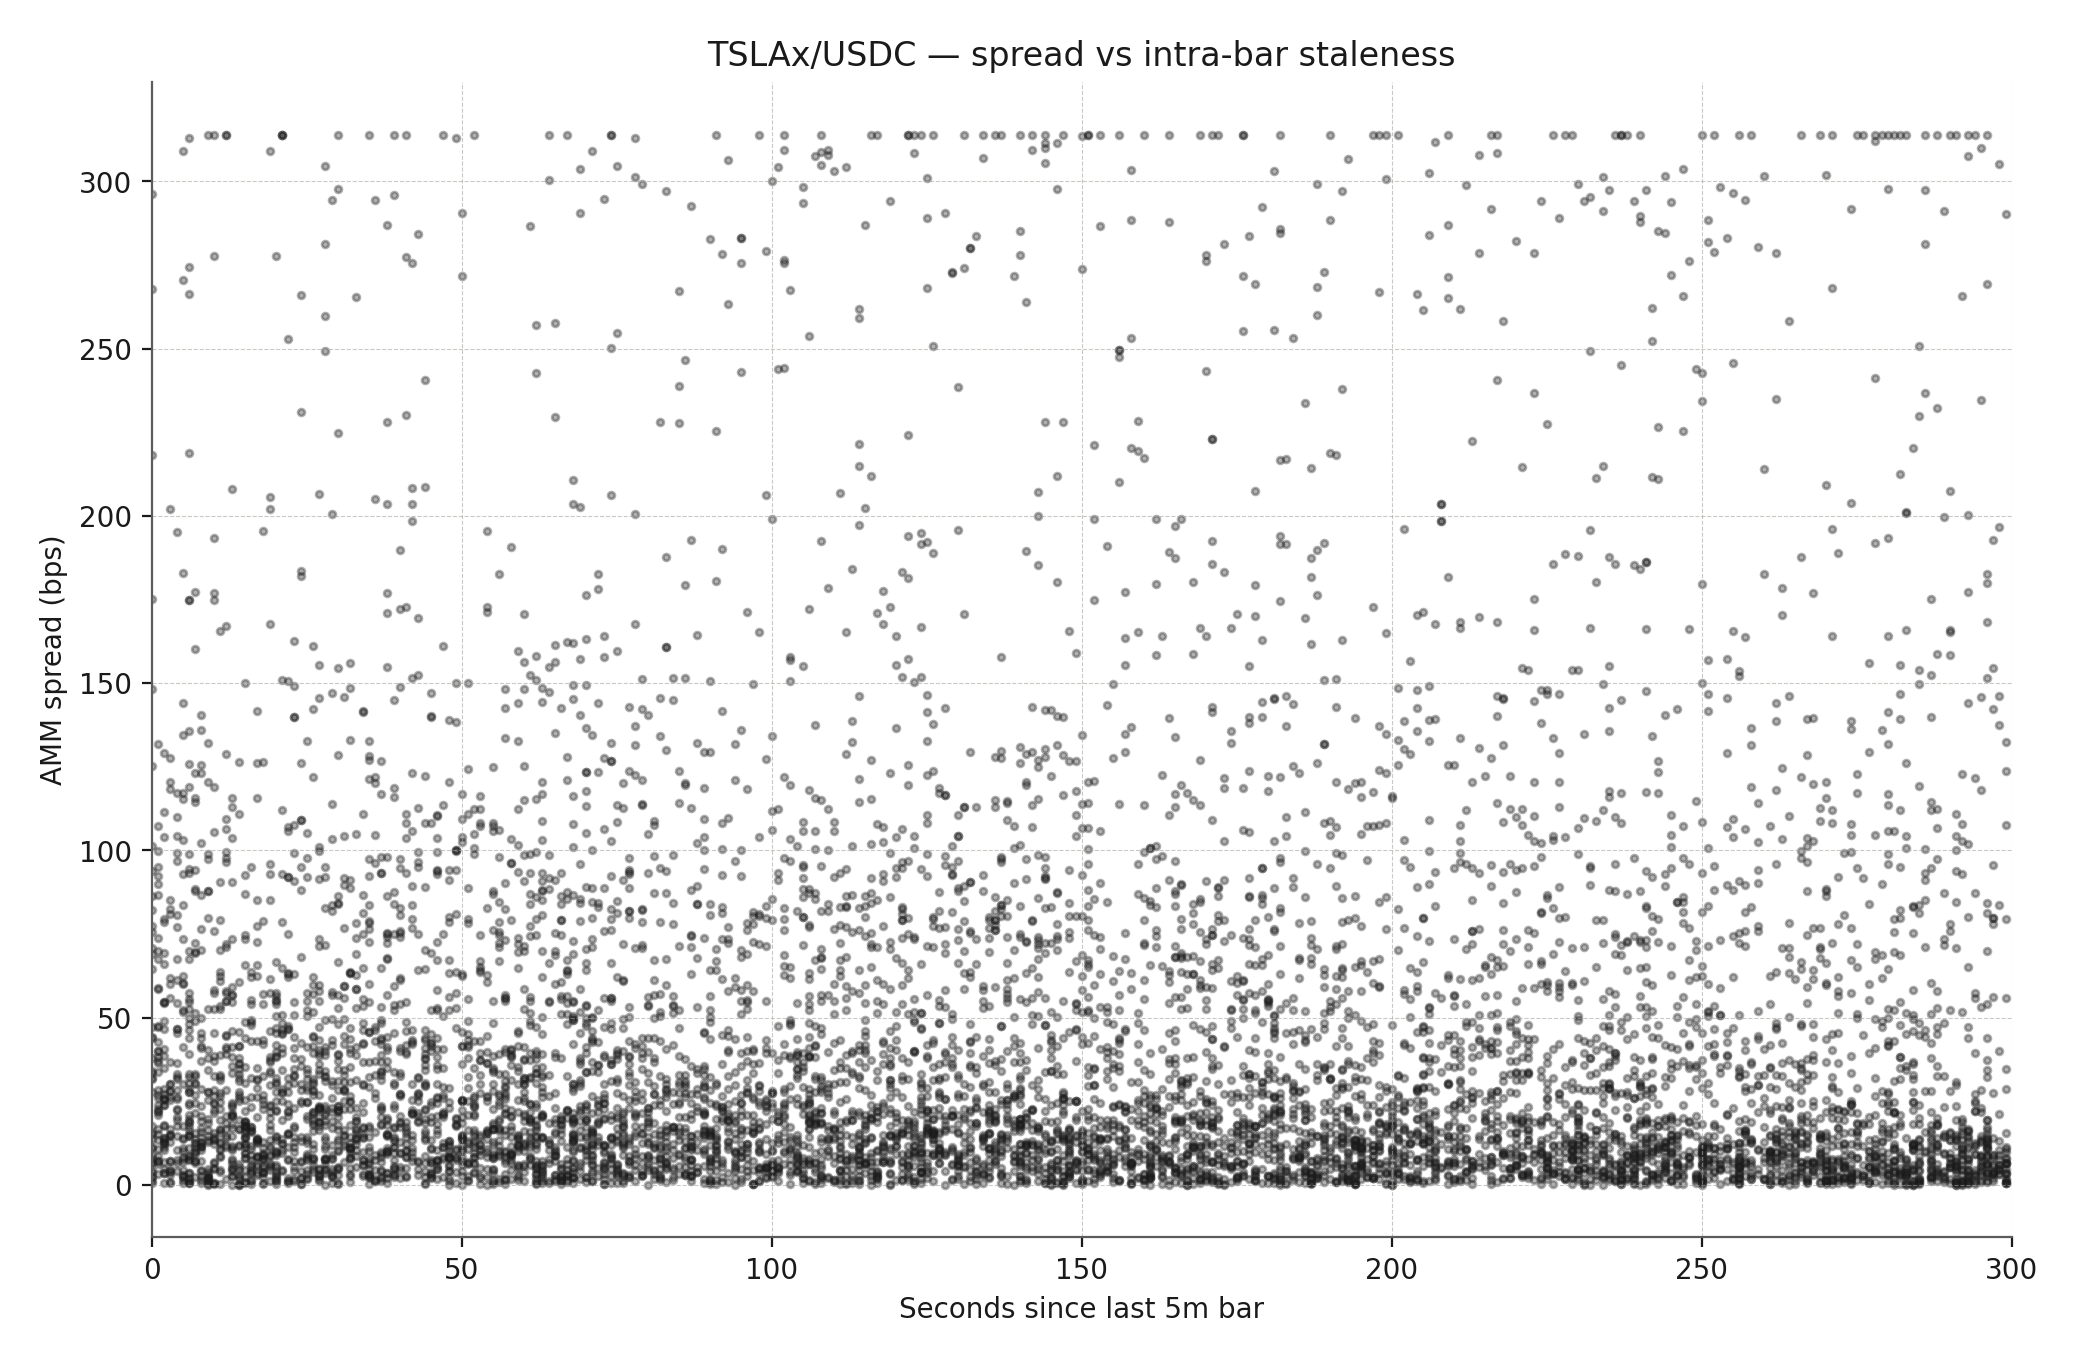
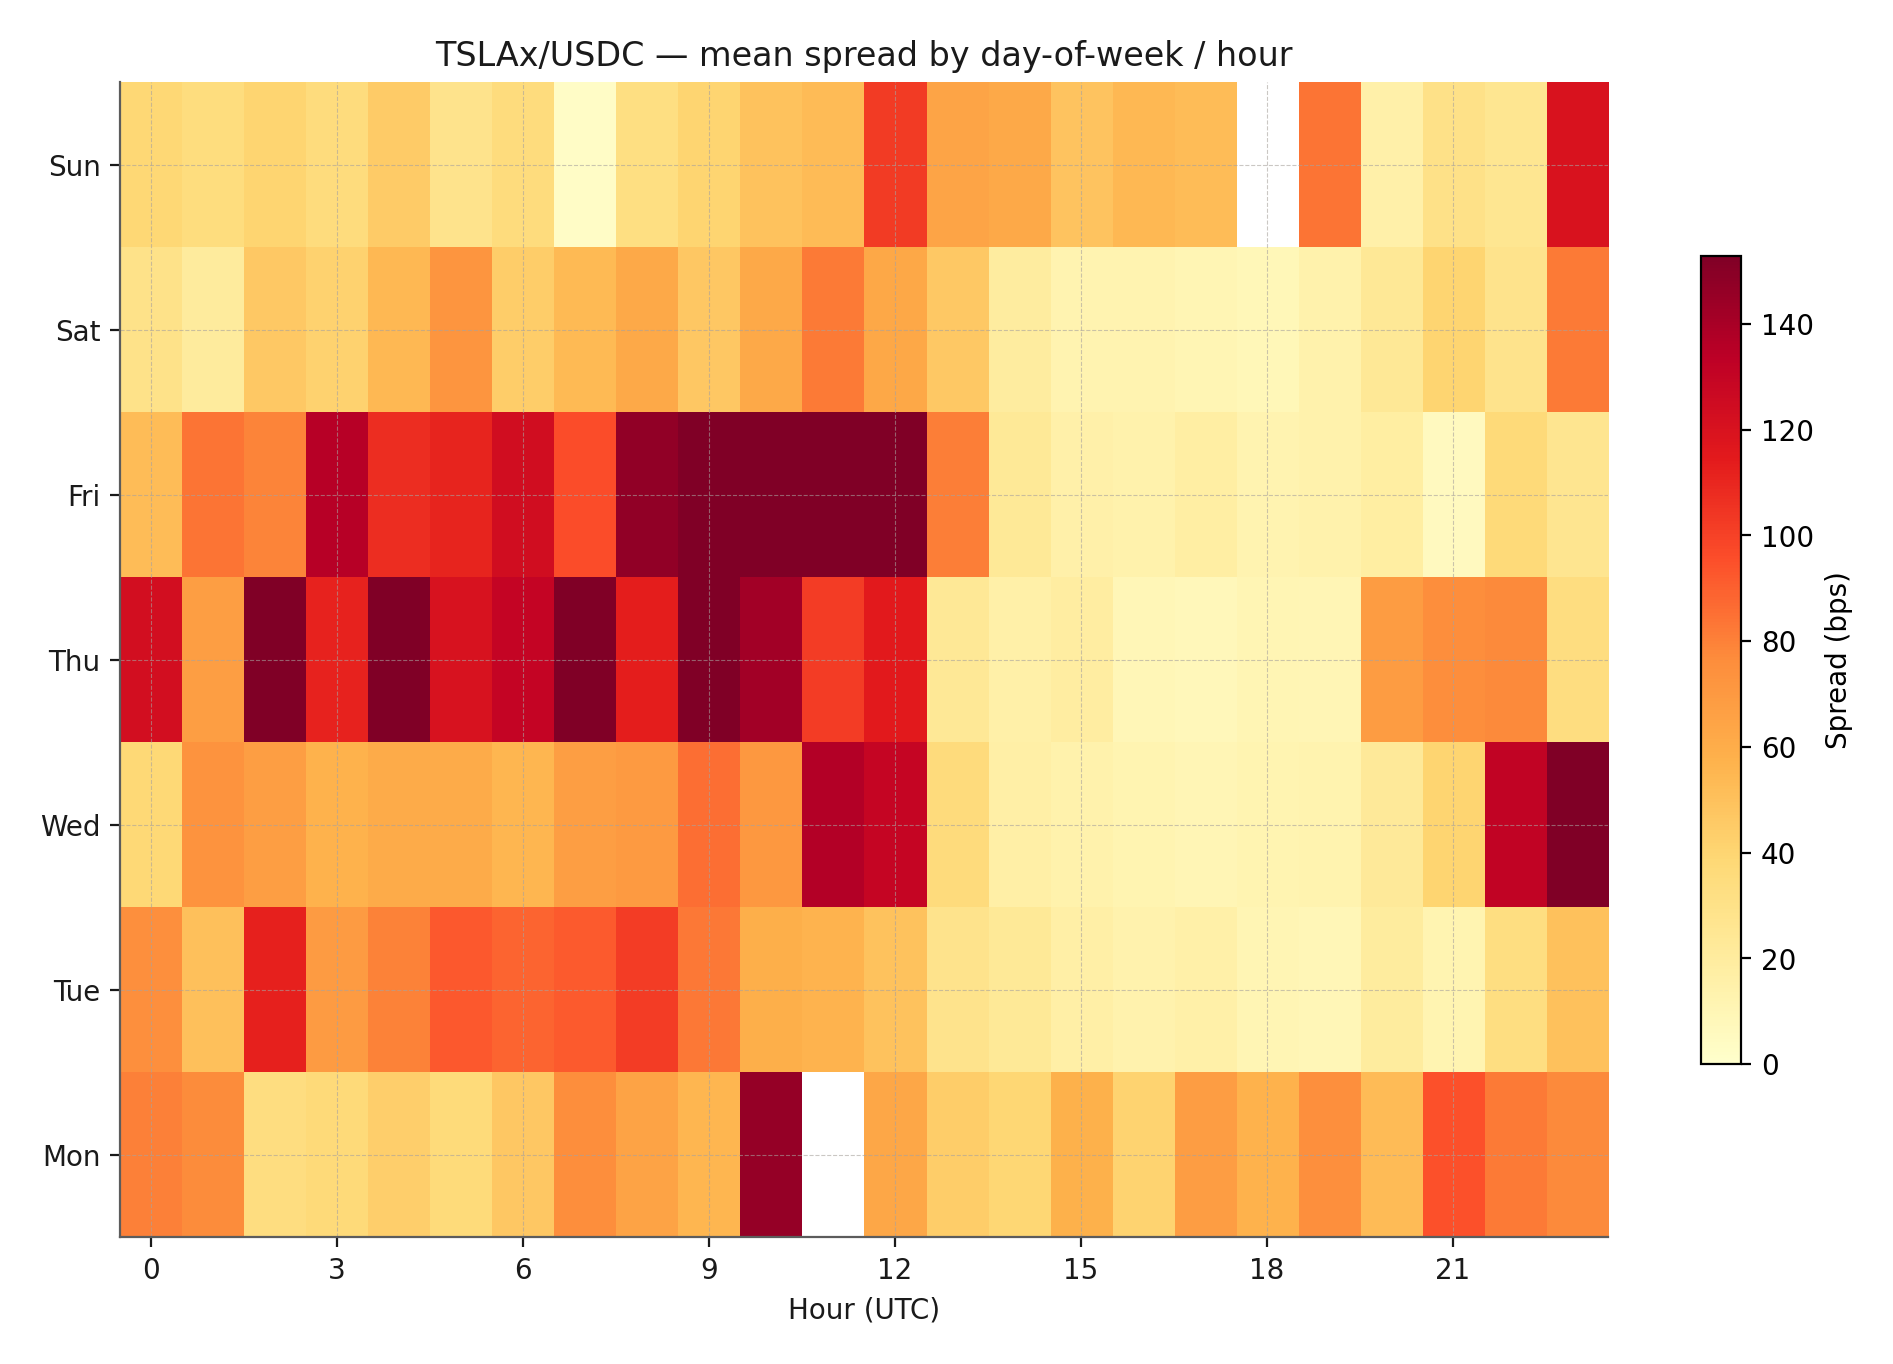
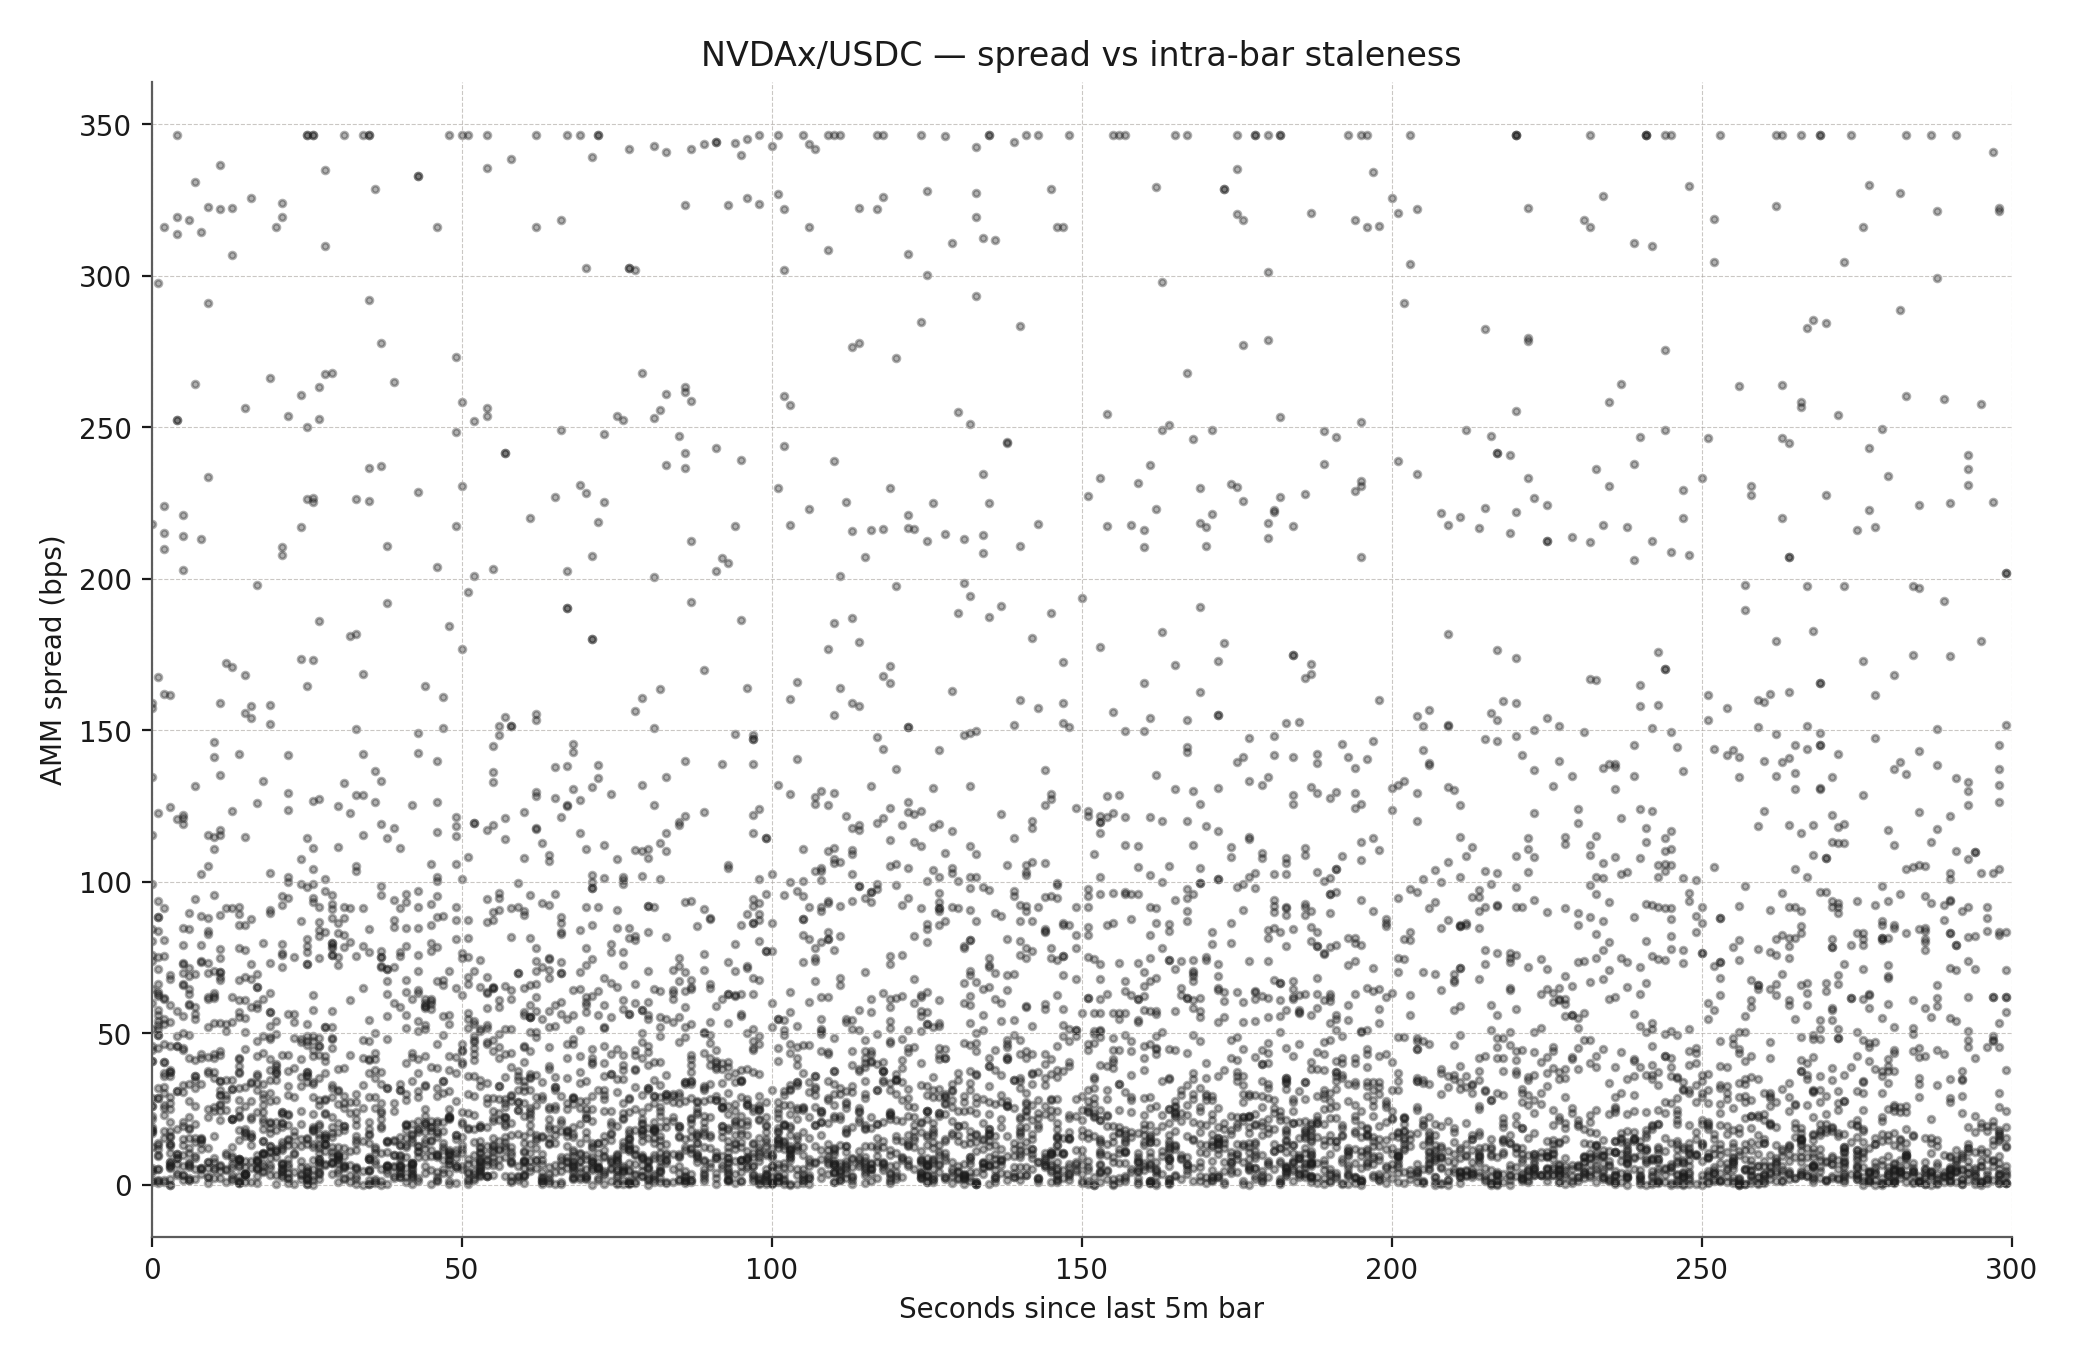
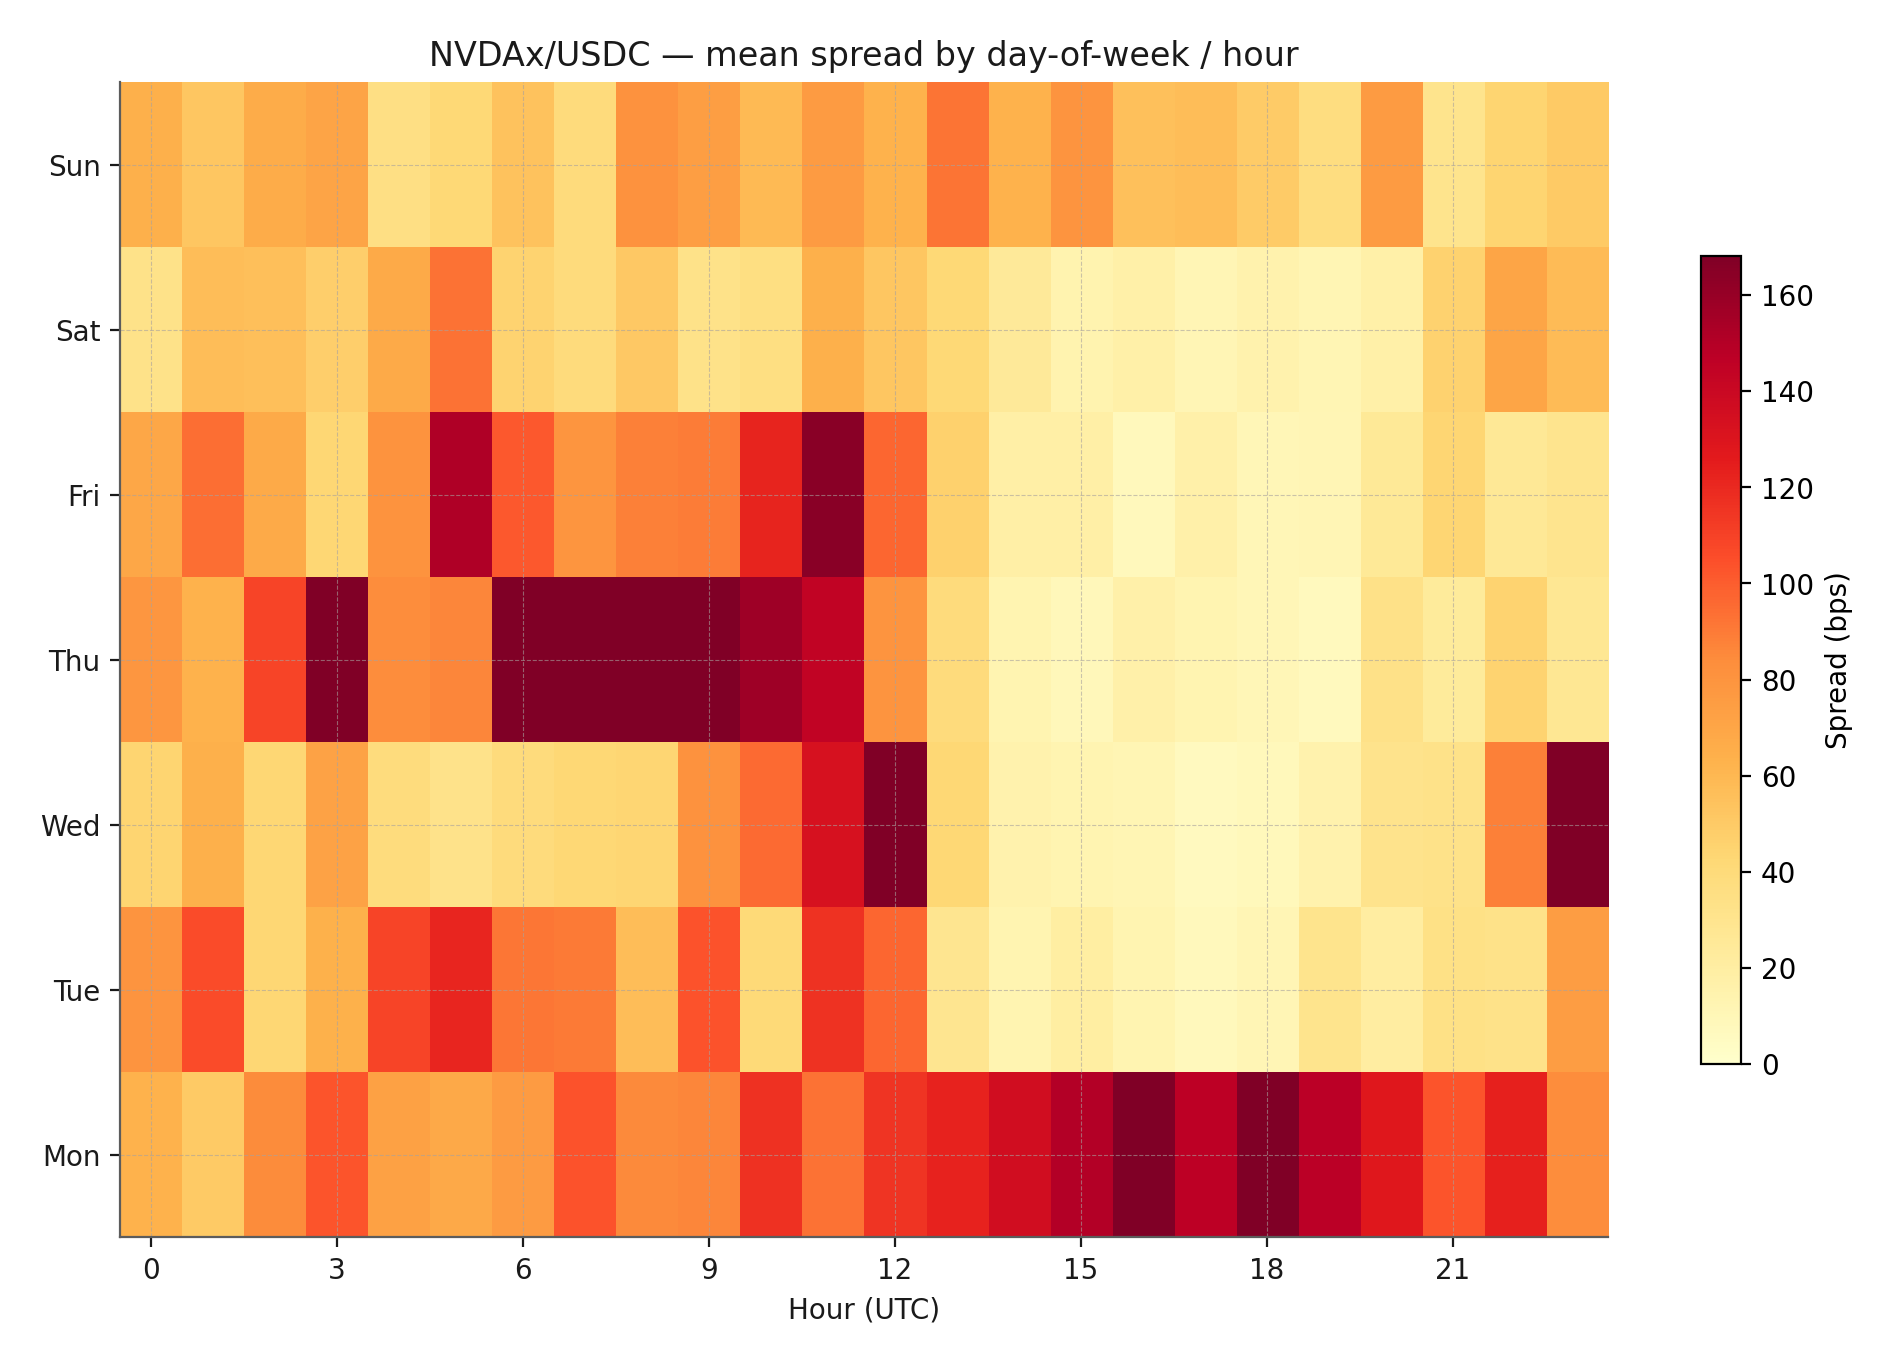
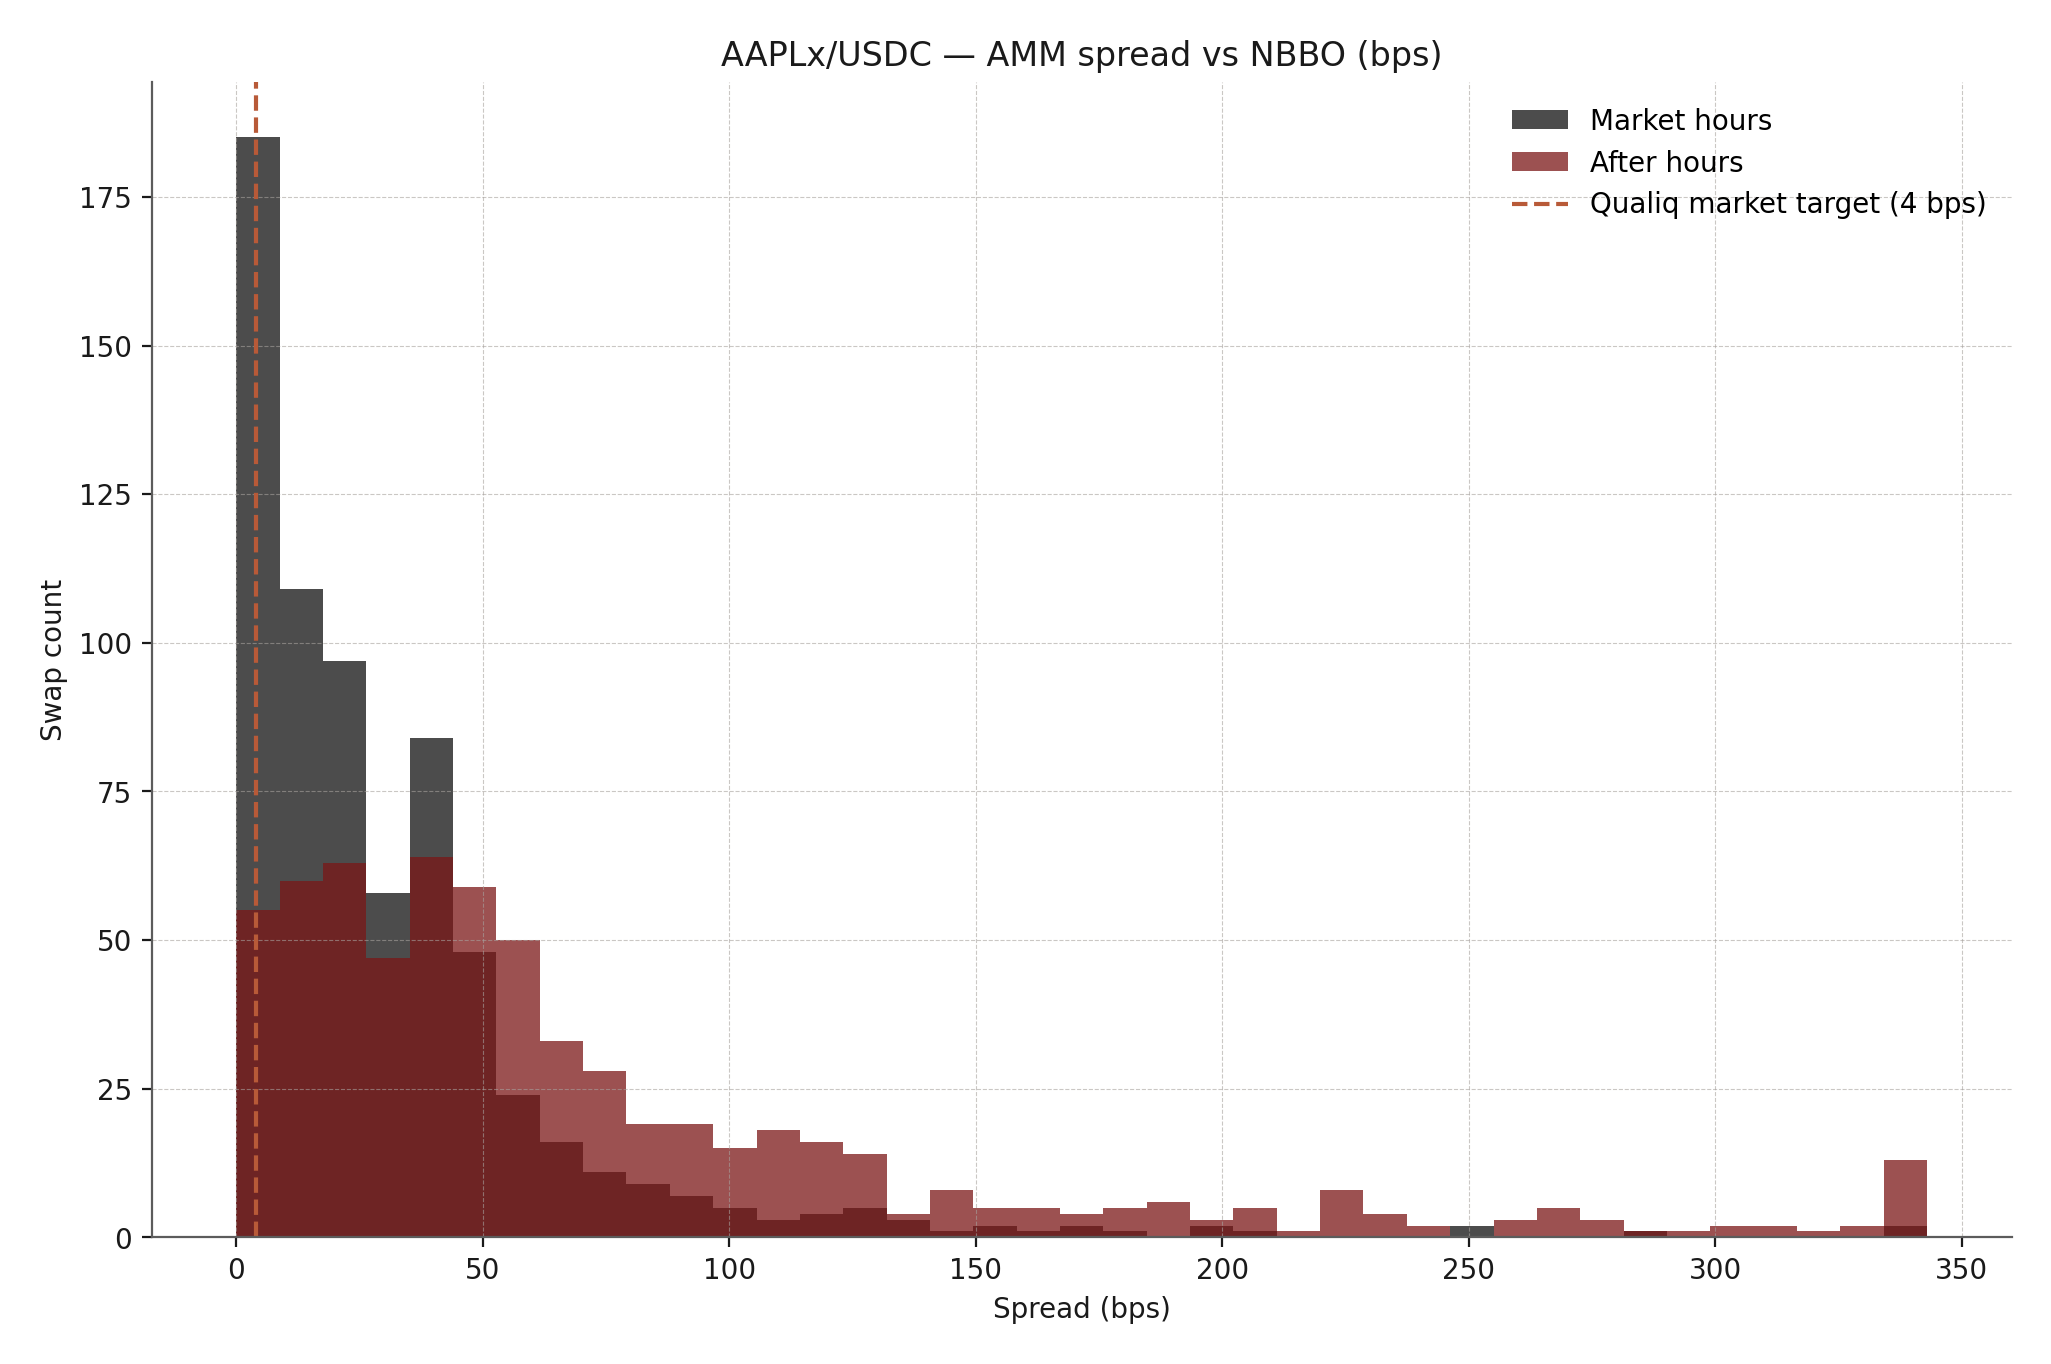
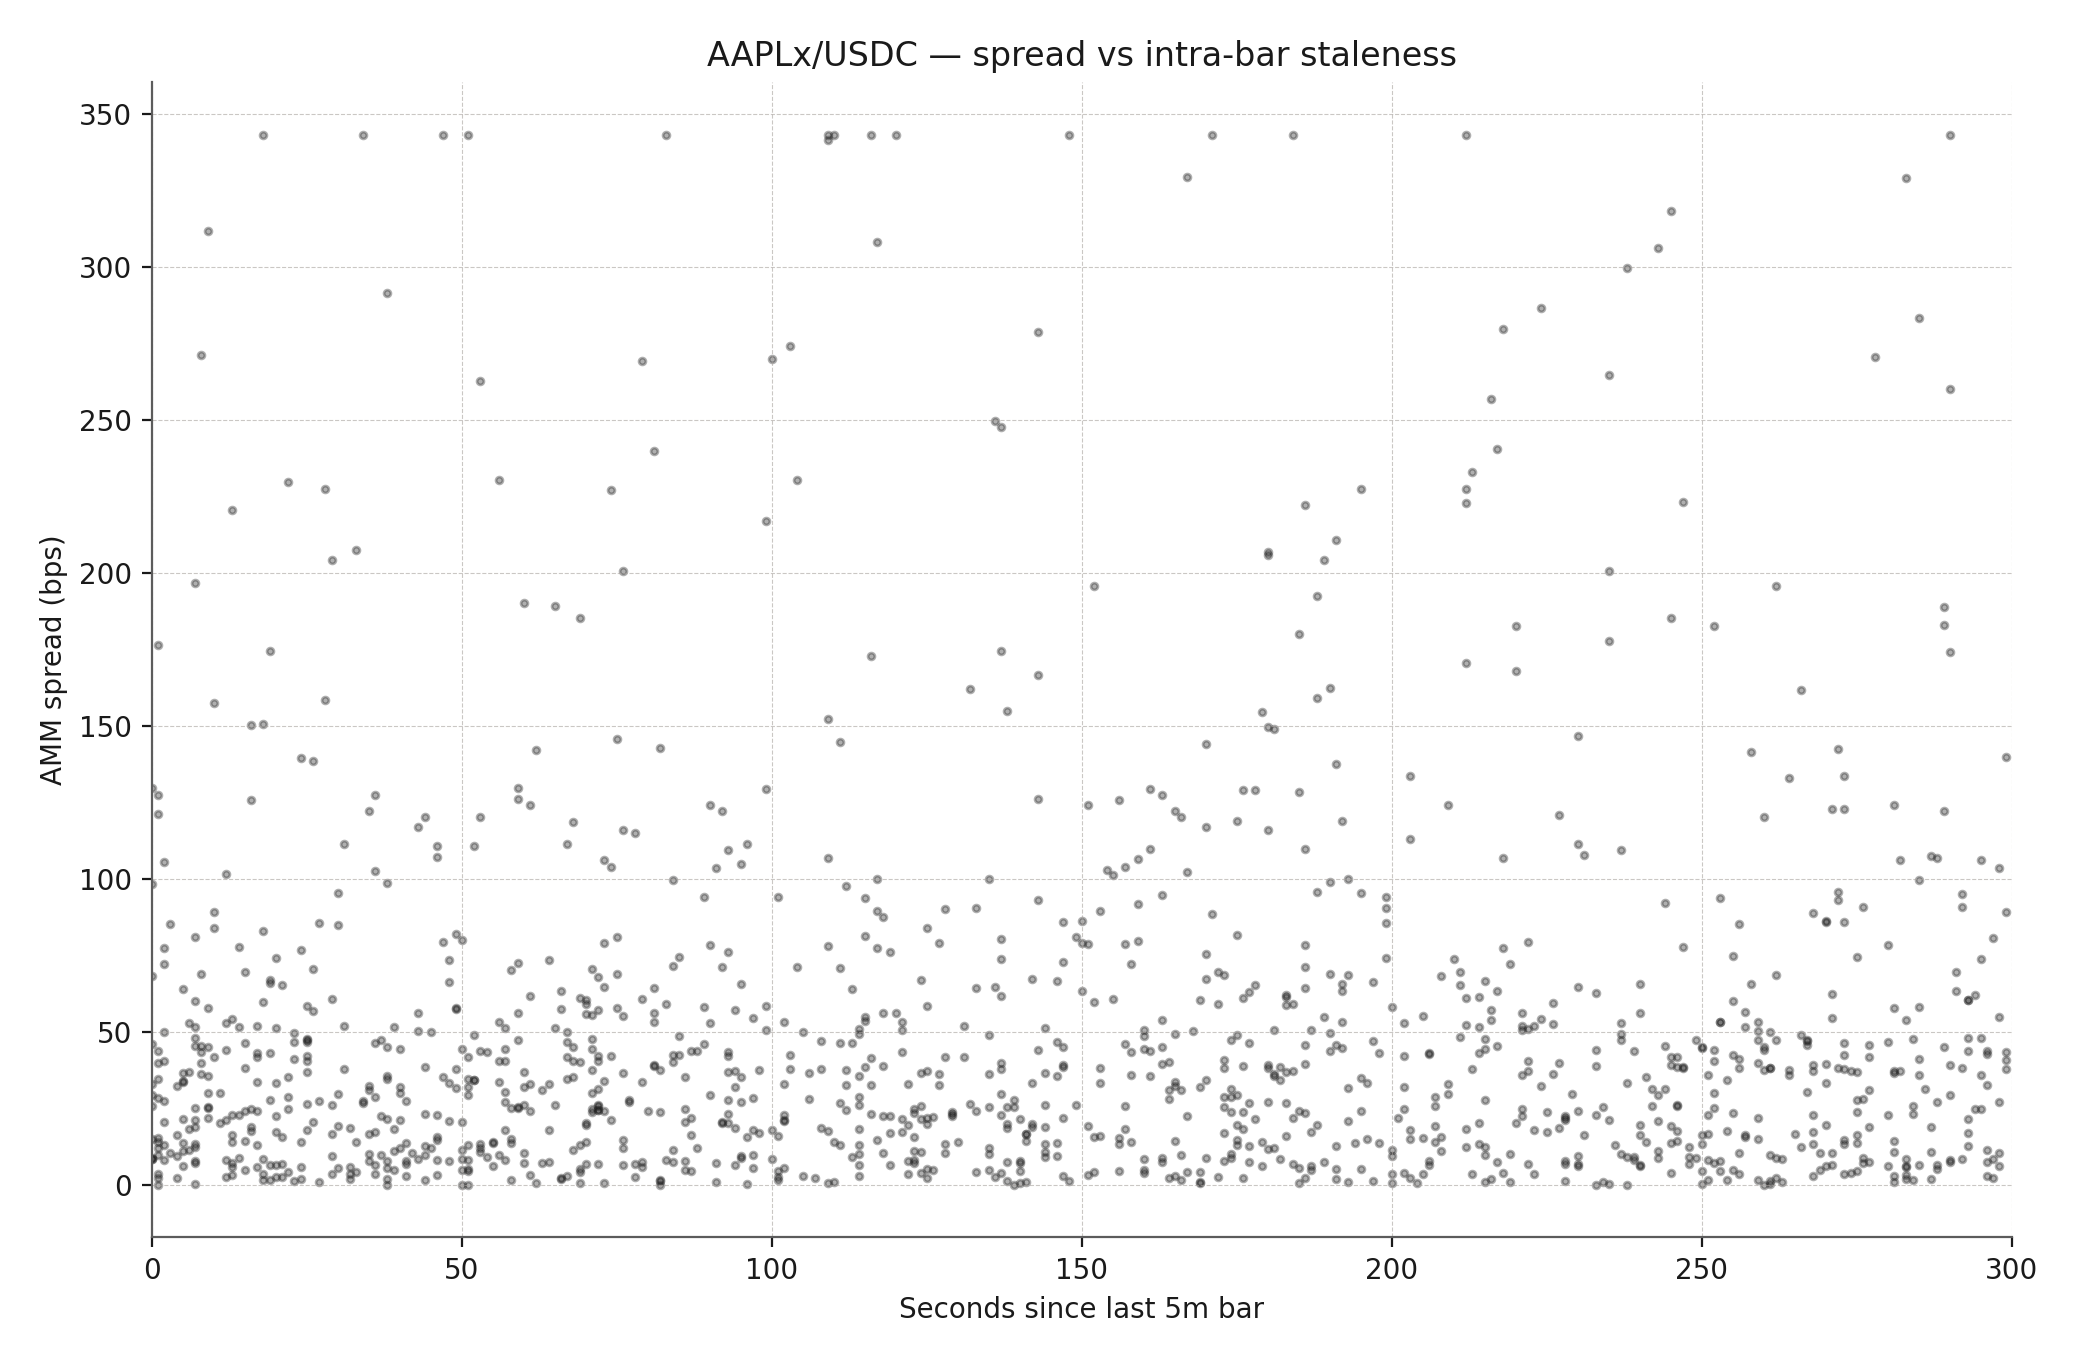
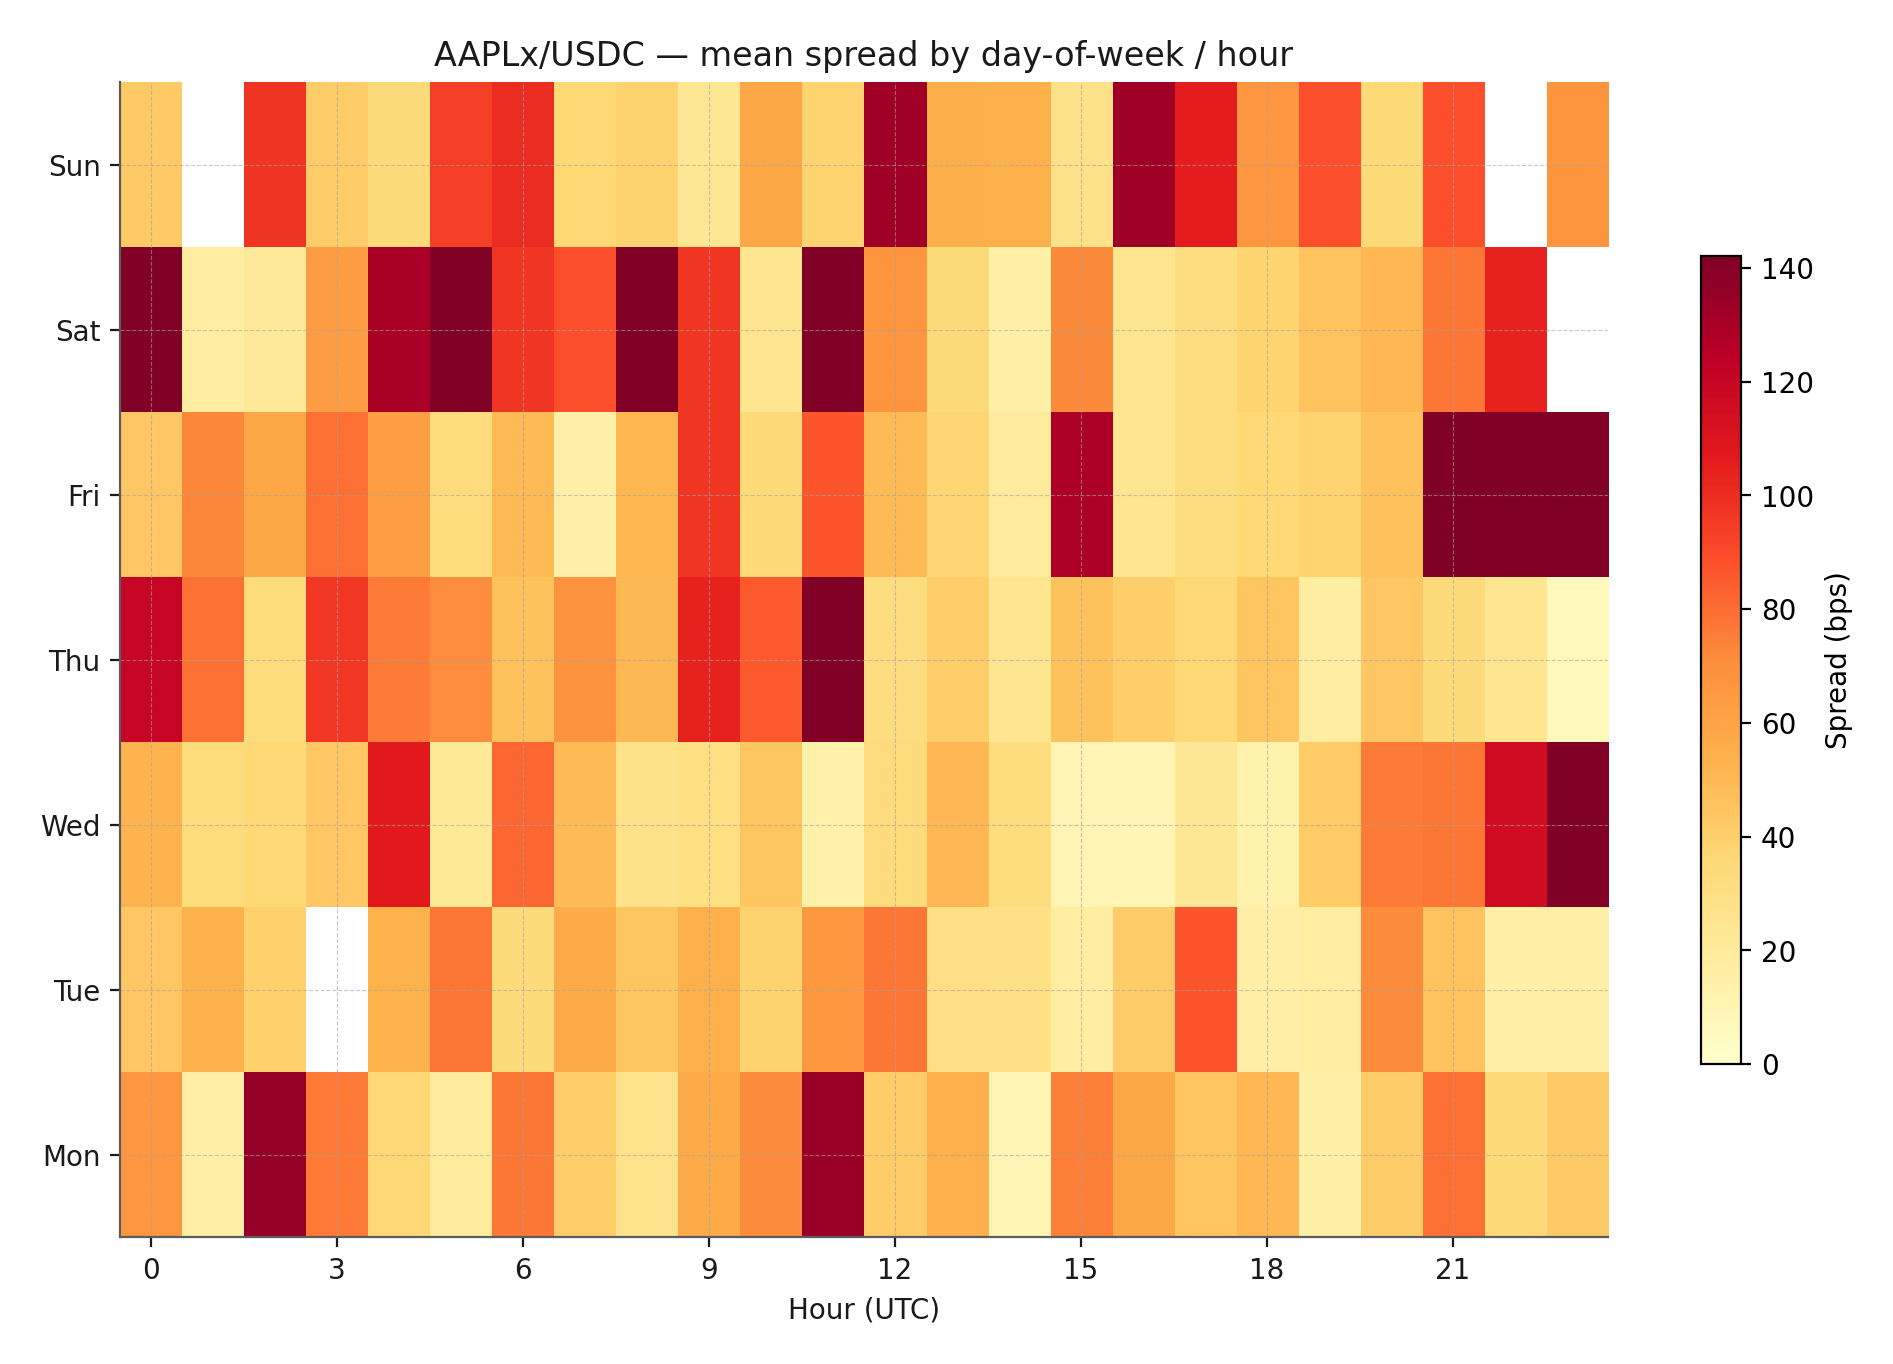
Each pair's section shows the full distribution against NBBO, broken out by session (market hours vs. after-hours), with three companion charts: the spread histogram, staleness vs. spread, and the intraday heatmap.
3.1 TSLAx/USDC
| Metric | Value |
|---|---|
| Market-hours p50 | 13.1 bps |
| Market-hours p90 | 51.4 bps |
| After-hours p50 | 71.1 bps |
| After-hours p90 | 284.5 bps |
| Fills measured (mkt / a-h) | 29,834 / 15,637 |
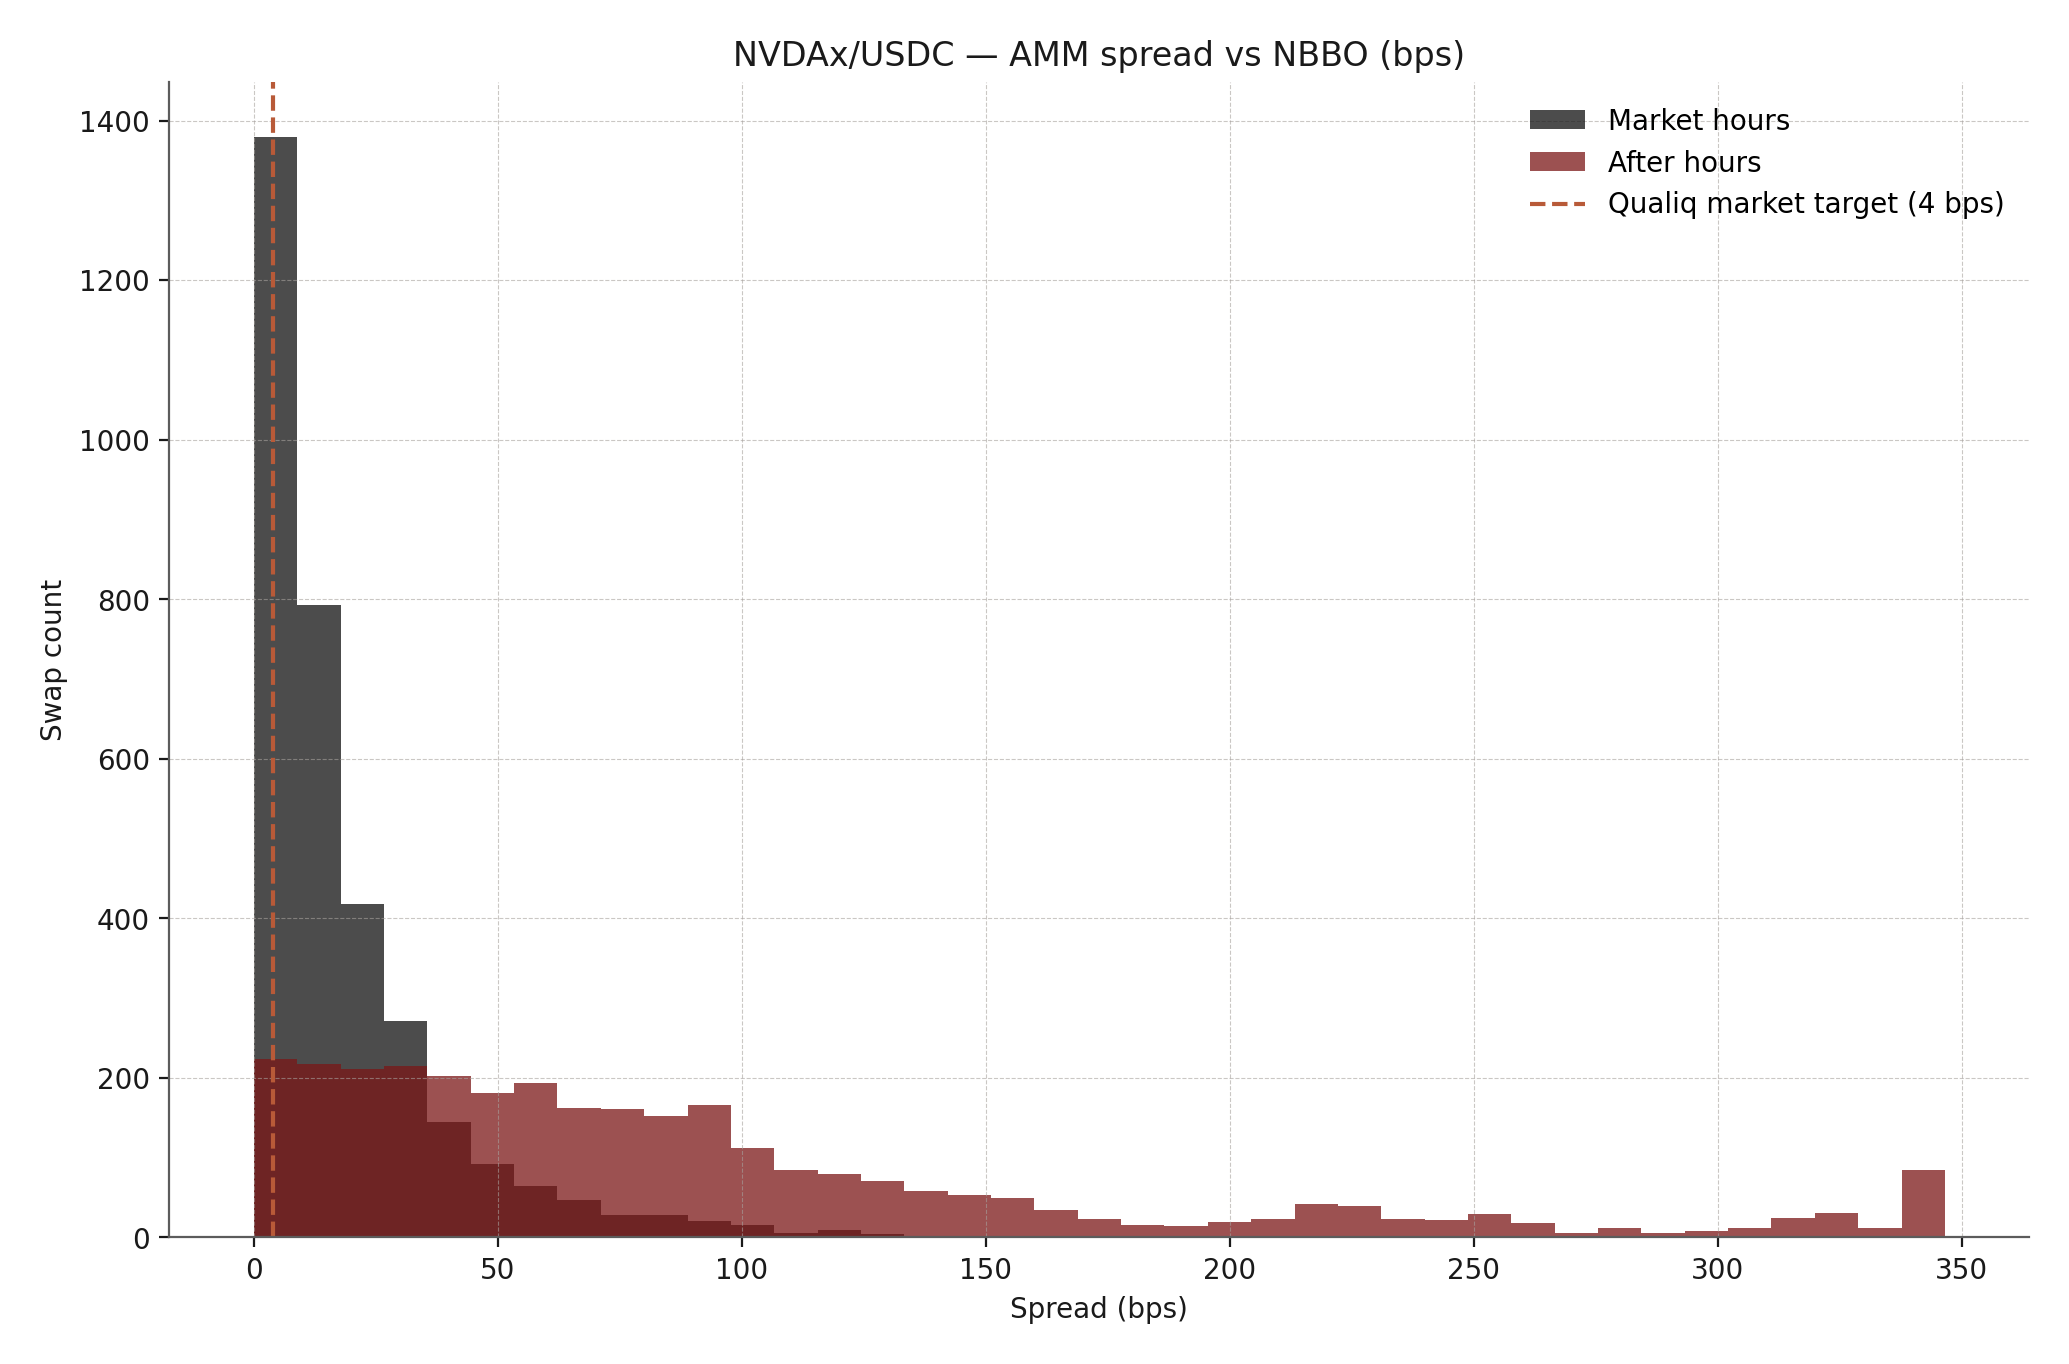
3.2 NVDAx/USDC
| Metric | Value |
|---|---|
| Market-hours p50 | 11.6 bps |
| Market-hours p90 | 45.4 bps |
| After-hours p50 | 42.3 bps |
| After-hours p90 | 119.0 bps |
| Fills measured (mkt / a-h) | 11,118 / 5,767 |
3.3 AAPLx/USDC
| Metric | Value |
|---|---|
| Market-hours p50 | 24.0 bps |
| Market-hours p90 | 69.8 bps |
| After-hours p50 | 62.6 bps |
| After-hours p90 | 294.1 bps |
| Fills measured (mkt / a-h) | 879 / 872 |
3.4 The long tail
Outside the deep majors, on-chain depth thins quickly and execution widens — in market hours and, sharply, after them. These are the names where a sponsored reward market has the clearest job: a real, measured gap to close, with dollar volume large enough to matter (MSTRx alone clears ~$17M, COINx ~$8M over the window).
| Pair | Swaps | Mkt p50 | A/H p50 | A/H p90 |
|---|---|---|---|---|
| MSTRx/USDC | 43,450 | 21.6 | 104.6 | 272.3 |
| COINx/USDC | 14,204 | 31.5 | 154.3 | 334.1 |
| HOODx/USDC | 11,119 | 31.1 | 155.4 | 394.0 |
| AMZNx/USDC | 4,194 | 19.4 | 92.8 | 279.4 |
| MSFTx/USDC | 3,584 | 45.5 | 129.3 | 235.9 |
| METAx/USDC | 2,786 | 27.1 | 93.6 | 582.2 |
| GOOGLx/USDC | 2,510 | 19.5 | 96.5 | 595.0 |
All values bps vs NBBO. Even the long-tail names carry thousands of fills each over the window; the after-hours widening is consistent across every one. The widest after-hours p90s (METAx, GOOGLx) sit on the thinnest after-hours samples — directional, not precise.
4. SOL/USDC — crypto-native baseline & methodology validation
This section replicates the Jump Crypto (March 2026) propAMM spread analysis using the same on-chain data methodology, establishing that Qualiq's analytical approach is sound and that sub-2-bps execution is demonstrably achievable on Solana for crypto-native pairs.
| Metric | Raydium CLMM SOL/USDC | Jump propAMM (middle 50%) |
|---|---|---|
| p25 spread | 1.17 bps | 0.33 bps |
| p50 spread | 3.16 bps | — |
| p75 spread | 5.65 bps | 1.36 bps |
Interpretation
Raydium CLMM SOL/USDC shows somewhat wider spreads than Jump Crypto's propAMM finding because CLMM is a passive AMM — it prices via inventory risk, not competitive quoting. PropAMMs (programmable AMMs with intent-based quoting) achieve tighter spreads by attracting competitive market-maker flow. The point for tokenized equities is the same: where execution is wide, competition among makers — rather than a single passive curve — is what compresses it. That is the gap a sponsored reward market is built to close.
A. Appendix — data sources & methodology
A.1 Data sources
| Source | Description | Auth |
|---|---|---|
| yfinance | 5-min equity / ETF bars (OHLCV) for the underlying tickers (TSLA, NVDA, AAPL, QQQ, SPY, COIN, HOOD, MSTR, …) | Free, no key |
| Binance klines API | 1-min SOL/USDT klines for CEX mid reference | Free, no key |
| QuickNode Solana RPC | getSignaturesForAddress + getTransaction (JSON-RPC batch) | QuickNode endpoint |
| Raydium v3 API | Pool state account discovery by mint (TVL-ranked) | Free |
A.2 Swap discovery methodology
-
Pool-based, not mint-based
Token mint accounts receive 5,000–15,000 signatures/day (mints, burns, transfers, all pools). Pool state accounts receive only that pool's swap/LP transactions — 10–100× fewer, targeted to the specific liquidity we care about.
-
Complete capture, no sampling
getSignaturesForAddress(pool_id, limit=1000)pages backward through the full history in the date range. Every transaction is decoded — there is no 1-in-N sampling and no extrapolation. The 243,280 swaps and $103.9M of volume are literal on-chain sums over the 30-day window. -
Batch transaction fetch
JSON-RPC batches of
getTransactioncalls per HTTP request, with a single-call fallback on any malformed batch response so no fill is silently dropped. -
Swap detection
Fee-payer's
preTokenBalancesandpostTokenBalancesmust show equal and opposite changes in base- and quote-mint balances.
A.3 Fair-value methodology
- Equity pairs (NBBO proxy) — ASOF backward join to the most recent 5-min bar.
market_openis computed from the swap's own UTC timestamp using NYSE trading hours (09:30–16:00 ET), not from the yfinance bar (which only contains market-hours data). - Crypto pairs (CEX mid) — ASOF backward join to the most recent 1-min Binance bar. Always-open (no market-hours concept).
A.4 Spread formula
spread_bps = |executed_price_usdc − mid| / mid × 10,000
A.5 Reference freshness & limitations
- Window. All figures cover the trailing 30 days, 2026-04-14 → 2026-05-13, ending at the latest observed on-chain block across the pair set.
- Reference-staleness gate. A swap's spread is only meaningful against a fresh fair-value reference. yfinance publishes 5-min bars during the regular session only, so a swap that lands in a coverage gap or halt would otherwise be scored against an ancient mid and produce a spurious spread. We therefore compute spread percentiles only on fills whose matched reference is fresh enough: < 6 minutes (one bar) in market hours, and ≤ 1 day after hours (where the mid is the last regular-session close by design). Swap counts and volume use the full on-chain set; only the percentiles use this measured subset. Fig 3.x.b (staleness vs spread) shows the effect directly — spread is a clean function of reference age, which is exactly what the gate removes.
- After-hours fair value. With no 5-min bar after 16:00 ET, the
midfor after-hours swaps is the last NYSE close. The after-hours numbers should be read as "vs last regular-session close" — a real and consistent off-hours premium, but a noisier reference than the intraday one. - NBBO proxy. yfinance provides the bar close as mid, not a true NBBO bid/ask. A true NBBO requires a paid market-data tier. Close-as-mid slightly underestimates spreads in thin markets.
- Long-tail robustness. All 13 pairs carry thousands of fills each over the window, so the long-tail names (MSFTx, METAx, AMZNx, GOOGLx) are more robust than in earlier sampled work — though still thinner than the deep majors, and their after-hours p90s in particular should be read as directional.